
Key Article Takeaways:
- SEO benefits are generally underappreciated in the influencer industry
- By the time SEO benefits are recognized, a brand manager can be in an entirely different role in a company
- Views and Impressions can often have a snowball effect component, building momentum over time after a campaign is over
- It's important to realize that sales will often follow the same path. Post-campaign sales cannot be ignored when reviewing influencer ROI
Last week we talked about Influencer Marketing as a “hits driven business” and covered the economics of virality. This week we want to dig deeper into a related phenomenon, the long term impact from organic SEO, specifically on YouTube, which we highlighted as one of the chief benefits of the platform in our article on Which Social Media Platform to focus on.
It’s long been my contention that these benefits are wildly underappreciated in the industry. In fairness, there’s a good explanation for this underappreciation. If we think of influencer marketing as a “substitute” (used here very much in the technical economics sense as a product that is comparable enough to replace another good or service) for paid media, we have to appreciate the characteristics of paid media, which include:
- Running within a defined period of time, or “flight” which is typically 30 - 60 days and generally not more than 90 days, which also of course corresponds to the quarterly budgeting, planning and results reporting that permeates business operations
- Essentially zero spillover media benefits. Once the media budget runs out, that’s the end of the impressions
Similarly, we try to do “wrap-up” calls with clients about 30 days after the last piece of content goes live. So it’s a little unfair for me to complain that SEO benefits are underappreciated: a campaign is complete, and we all move on to the next thing. By the time the SEO benefits are truly realized, a brand manager is probably in a different role in the organization.
To discuss, I’m going to focus on a single gaming campaign from mid-2020 that neatly illustrates the impact. It’s entirely post the initial ‘shock’ of COVID while still giving us two full years of date to work with, it was an exceedingly simple campaign featuring just two influencers and it performed really well from both a views and sales perspective, although in no sense was the content ‘viral.’ It’s not scientific in that I’m not looking over dozens of campaigns. Will leave that to the team that writes White Papers, but I will say that while not every campaign performs this way, enough do that you would absolutely see these trends in any statistically material study.
First, let’s look at the views for the two videos graphed from the time the campaign launched in June 2020 through June 2022:
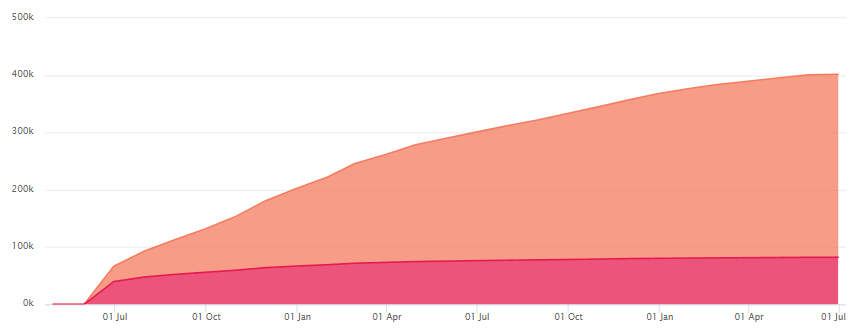
You notice right away that the “orange” video has driven a lot of the performance. This is the “non-viral” version of a “hit.” After around 90 days, the video had 60K views (right in line with our expectations, by the way) and today it is at 320K views, more than a “five bagger” from the end of the initial “flight”. But to be clear, in no way did the “red” video underperform. It came out of the gate incredibly fast, garnering 40K views in the first week. After 90days it had settled out at 50K views and we could assume that was it. But it wasn’t. Today that video has 82K views, which is 60% more than at the end of the initial 90 days. If you think like me, 60% value add is a pretty amazing bonus. And speaking of bonuses: bonus learning on illustrating how graphs can be visually deceptive although in this case we’re hiding something good vs. making dressing up weak performance.
Now let’s look at attributed sales for this campaign:
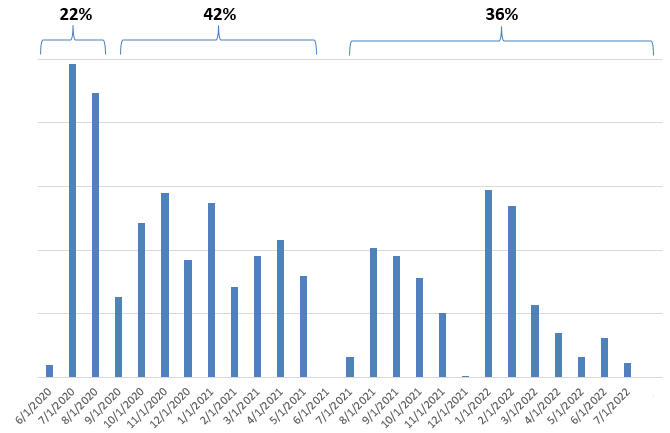
Rather than graphing the sales cumulatively, here we switch the perspective and show periodically which gives a completely different perspective on how things play out over time. And we can absolutely understand how, if we judged this campaign based on the sales impact over the initial flight, we missed the story entirely. Only 22% of the sales impact occurred over the first three months of reporting. Almost 80% of the story was still to be told. There’s also an interesting symmetry where about half of that story got told in the next 9 months (perhaps while the “subject” of the videos was still the most current generation of equipment). But then, in year 2 we see two interesting boosts: one presumably tied to the next generation being launched, causing people to do ‘deep research’ (note that tracked sales capture ALL brand related sales and so are not limited to the sales of the exact product promoted) and then an additional boost related to holiday shopping.
Although we graphed views and sales completely differently, they are pretty highly correlated in this example. 28% of the total views occurred in the first 3 tracking months, compared to 22% of the sales. In some cases, that ‘spread’ can be a lot higher: an influencer’s subscribers may not be in the market for the product but once you get into the “researchers” more heavily represented in the SEO views, sales attribution can surge even more dramatically.
So, how does a brand bake these SEO benefits into their planning? I know how we do it at gen.video but that’s a bit proprietary (although not exactly revolutionary). Ultimately, the answer is up to the practitioner but if done well there is no doubt that it can inform a superior influencer marketing strategy.