
We are excited to announce some updated to gen.video's performance analytics area. The development team is calling it a "Patch" but apparently the marketing team doesn't know what that term means because when we looked over the release notes, we were blown away. If this is a patch, we can't wait to see what they have in store for "general" releases in 2023!
Based on client demand and gen.video’s constant strive to be a trend-setter in the performance marketing space, we’re constantly upgrading our technology to provide top-notch solutions for full-funnel influencer marketing. Our latest patch includes the below updates and additions that spark the beginning of an amazing 2023 for Backstage users.
Traail™ Performance Analytics Updates
Several new features and product updates were released today that we can’t wait to share with the world of performance marketing.
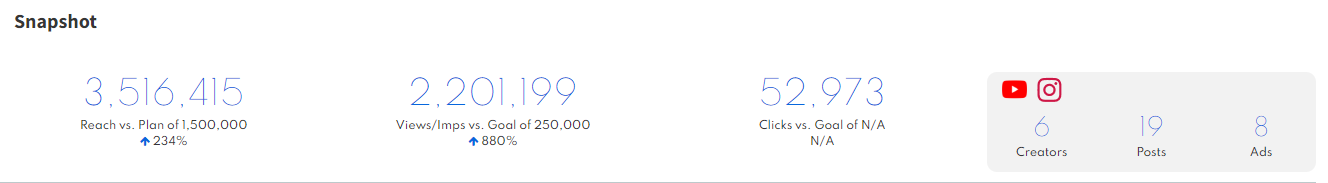
Campaign Snapshot
Track your preferred metrics at the top of your backstage experience in order to easily see the analytics that matter to you and your team.
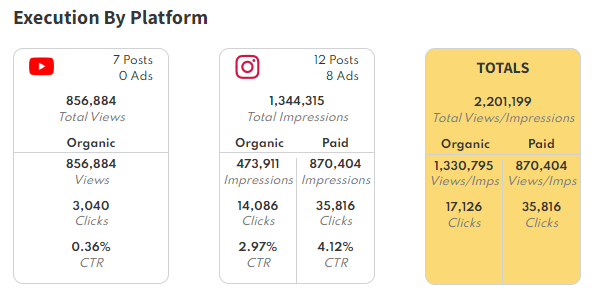
Campaign Execution By Platform
One of our top priorities for clients is to allow marketers to optimize programs mid-campaign which comes to fruition on many different levels. The ability to easily analyze organic and paid results is imperative to this priority, and now Backstage users are able to easily separate and visualize performance by platform.
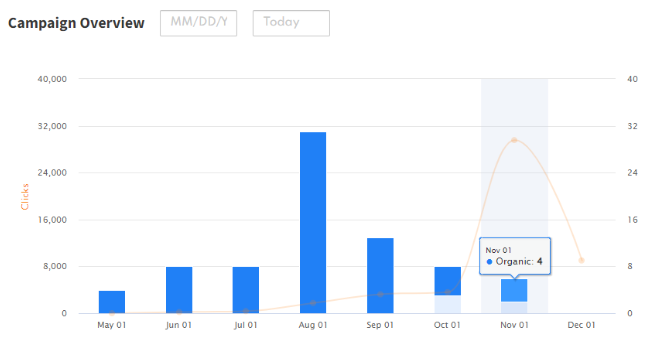
Campaign Overview Chart: Paid Media Brand Purchases Now Available
Full-funnel influencer campaigns are at the heart of gen.video’s value proposition, and the ability to track and optimize programs based on sales is something that our clients use as the cornerstone to build successful influencer strategies.
Backstage users can now track both organic and paid brand purchases easily through several areas of the platform, all to be filtered into and showcased with your Campaign Overview graph to compare and analyze your omnichannel success.
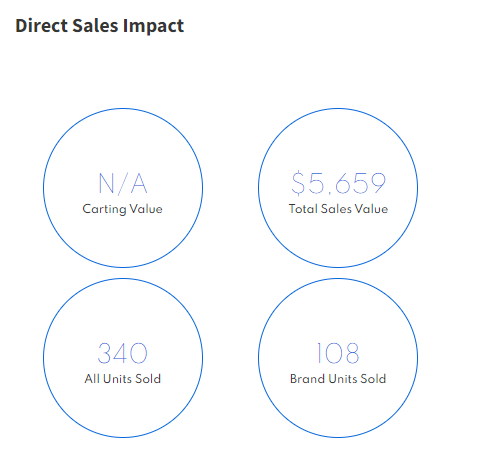
New Section in Backstage: Direct Sales Impact
Backstage users now have access to a Direct Sales Impact section in which you'll easily be able to analyze lower-funnel metrics attributed from utilizing gen.video's performance tracking links.
If you're using Add-to-Cart links as well, you can see Carting Value which will showcase how many dollars worth of your product were successfully added to consumer carts across most major retailers.
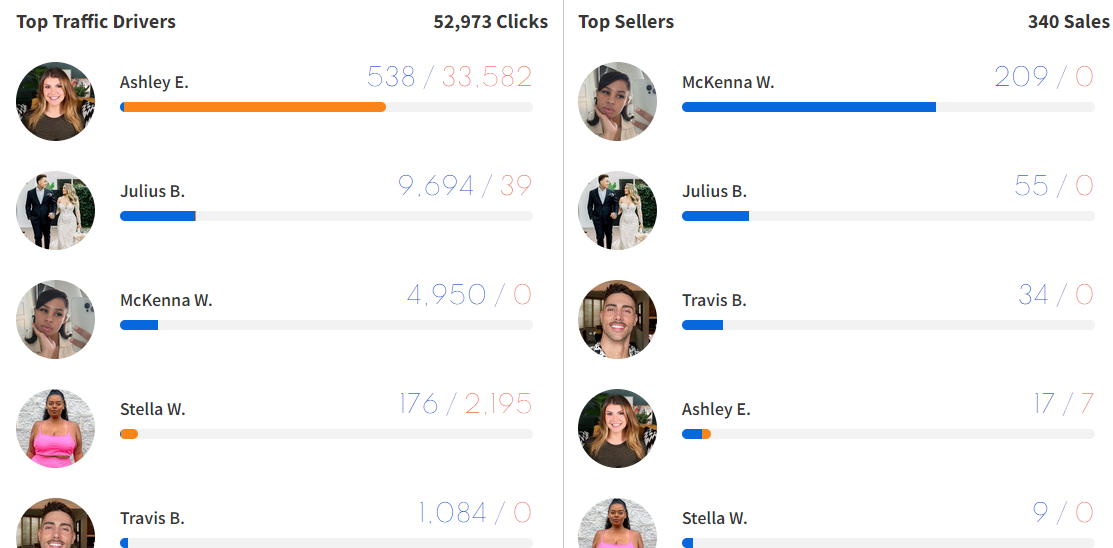
New Ways to View Top Creator Traffic Drivers and Top Sellers
Backstage users now have the ability to differentiate between Paid and Organic when looking at which Creators are selling and driving the most traffic for their program.
Part of running paid campaigns through gen.video includes the ability to not only take advantage of the Auto-Optimization feature that's naturally integrated into the paid platforms, but to make sure that whichever post the platform is choosing is actually the one that's producing the most sales.
Sometimes Meta, TikTok, or whichever platform you're using will prefer one piece of content because of its low CPC, CPM, etc., but in fact it's another post that the platform sees as "less efficient" that is actually driving the most sales. With these insights, we're able to shift funds to the sales-centric posts that the platform would have otherwise ignored.
Check out the Traail™ Performance Analytics page on our website to learn more →
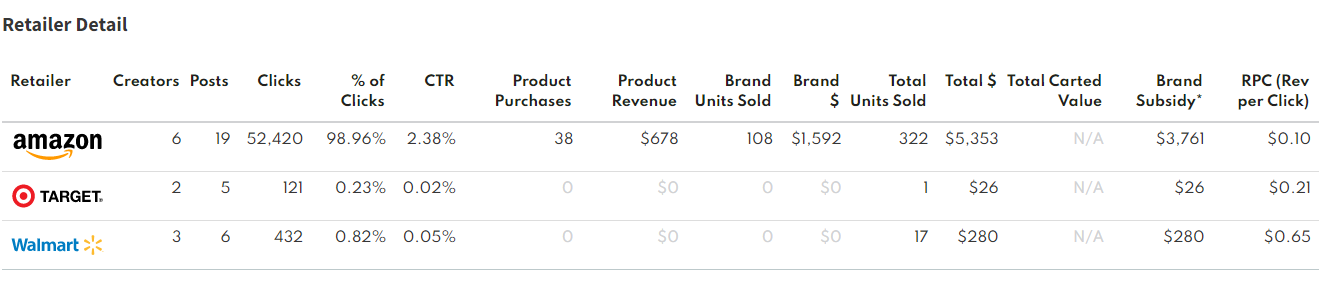
Retailer Tab Updates
Added "Totals" Metrics
For each retailer used in the program, Backstage users can now see:
→ Total Carted Value: Sum of $ of all items added to customer carts
→ Total Sales: Sum of $ for all products sold in a campaign
Added New Retailer Detail Metrics
For each retailer used in the program, Backstage users can now see:
→ Product Purchases
→ Product Revenue
→ Brand Units Sold
→ Total Units Sold
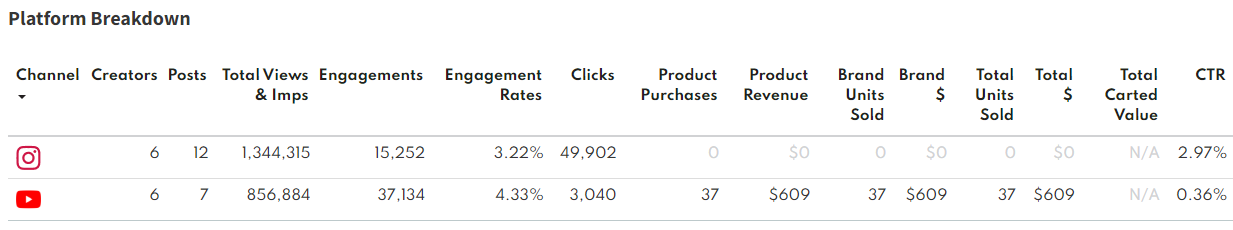
Platform Tab Updates
Establishing which platforms are performing the best is essential to be able to know where funds should be spent, and where your target consumers are most positively reacting with your influencer programs.
We've added metrics to the Platform Breakdown tab for Backstage users to see across all of the influencers on their program:
→ Traffic: Total clicks to 3P sites or DTC's
→ Product Purchases: Total # of non-brand products sold
→ Product Revenue: Sum of $ of non-brand products sold
→ Brand Units Sold: Total # of brands products sold
→ Brand $: Sum of $ of brand products sold
→ Total Units Sold: Total # of all (brand and non-brand) products sold
→ Total $: Sum of $ of all (brand and non-brand) products sold
→ Total Carted Value: Sum of $ of all items added to customer carts
→ CTR
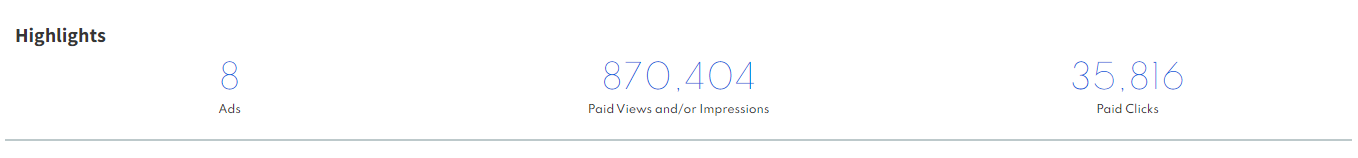
Paid Media Tab Updates
Paid Media "Highlights" Section
We've added a new Highlights sections for Backstage users to easily track the most commonly used paid media analytics that includes:
→ Number of Ads
→ Paid View and/or Impressions
→ Paid Clicks
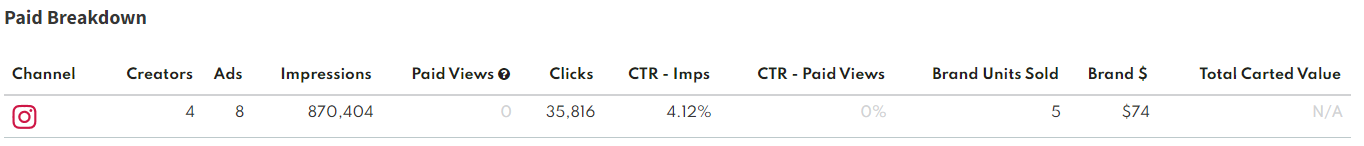
New Paid Media Breakdown Analytics Table Added
This new analytics table gives Backstage users a full breakdown of their paid media performance across major metrics needed to track campaign performance. Analytics include:
→ Number of Creators
→ Number of Ads
→ Impressions
→ Paid Views
→ Clicks
→ CTR - Impressions
→ CTR - Paid Views
→ Brand Units Sold
→ Brand $ Sold
→ Total Carted Value
Report Download Updates
Downloading reports is a key part of the fulfillment and analyzation of any influencer program, and we've made several updates to the metrics that Backstage users can see for all reports downloaded through our platform. For each report, we've added:
→ Brand Units Sold: Total # of brand products sold
→ Brand $ Sold: Sum of $ of brand products sold
→ SKU Units Sold: Total # of non-brand products sold
→ SKU $: Sum of $ of non-brand products sold
→ Total Units Sold: Total # of all (Brand and non-brand) products sold
→ Total $: Sum of $ of all (Brand and non-brand) products sold
→ Engagements
→ Engagement Rate
→ Carted Value: Sum of $ of all items added to consumer carts
New Platform Performance Downloadable Data Split by Organic and Paid
Adding on to the many updates that showcase Backstage users how organic versus paid budgets are performing, new data in our main downloadable report looks at platform performance showcasing:
→ Platform→ Post Count
→ Reach
→ Impressions (Organic)
→ Impressions (Paid)
→ Views (Organic)
→ Views (Paid)
→ Clicks (Organic)
→ Clicks (Paid)
→ CTR Benchmark
→ Impressions (Combined Organic + Paid)
→ Views (Combined Organic + Paid)
→ Clicks (Combined Organic + Paid)
→ Clicks
Influencer Tab Updates
New Social Channel Options
We understand that social media is evolving across platforms and want our tools and solutions to keep up with the times. Users can now choose shorts, Reels or Discord in your influencer campaigns.

Interested in learning about these tools and our other offerings? Schedule a demo here.